Optimization Reports
Presently we have one standard optimization report entitled Pool Optimization. This report is mobile-specific for accounts that have voice and/or data pooling plans. This report will not generate data results for wireline-only accounts.
Using the Pool Optimization Report
The Analytic Usage by Line page presents summary level reporting in usage by line for total usage (GB), total usage to optimize, total allowance, quantity of lines, plan cost, new plan cost, new allowance, and zero usage.

The detailed report grid provides you the following information:
Column header | Description |
|---|---|
Vendor | |
Raw Data | |
Usage (GB) | |
Allowance | |
Q Lines | |
Plan Cost | |
Overage | |
Optimization: New Plan Cost | |
Optimization: Savings | |
Optimization: New Allowance | |
Optimization: Q Plan Changes | |
Files |
Report Options

Customizing your Grid view
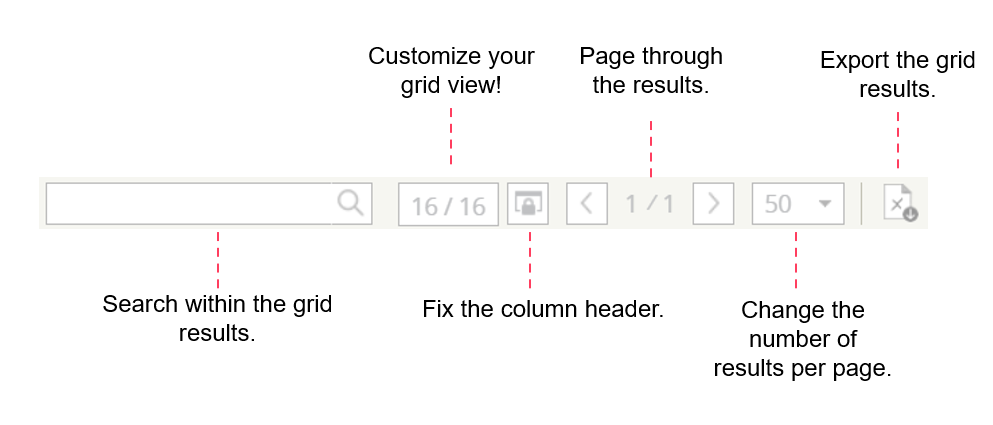
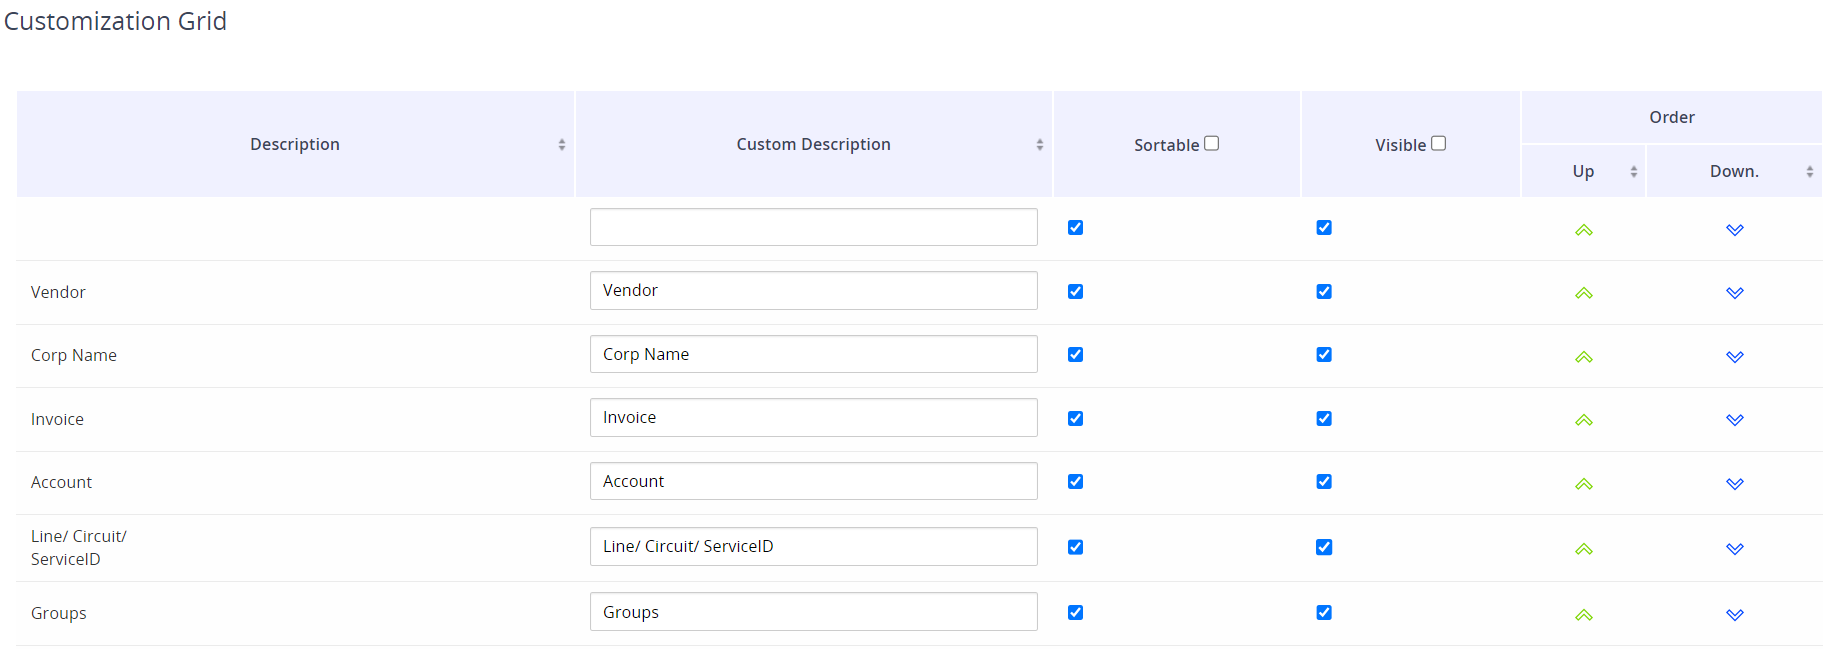
There are 16 columns that are part of the Grid view. When you click on the Customize Grid icon, you will see the options to:
Relabel each column header
Make a column sortable
Expose / Hide a column
Move the column order position up or down

When you are done, scroll to the bottom of the page and click Submit. You may also click Reset Value to revert back to the default setup as determined by Asignet.

